
Paired - Samples T Test in SPSS
Paired‑Samples T Test compares the means of two measurements taken from the same individual, object, or related units.
Paired‑Samples T Test has the following hypotheses:
Null hypothesis: The mean of the paired differences is equal to zero.
Alternative hypothesis: The mean of the paired differences is not equal to zero.
Assumption
1. Variable should be continuous.
2. Observations should be independent.
3. Dependent variable should be approximately normal.
4. Outliers should not be for the dependent variable.
A group of students were subjected to the test before attending a training program and then again after completing the training program. An attempt was made to find any difference in marks scored before and after attending the training program.
In SPSS, Paired‑Samples T Test is found in Analyze > Compare Means > Paired-Samples T Test

Then, we will get Paired-Samples T Test dialog box.

Add the variable ‘Pre-test’ in the Variable1 box and add the
variable ‘Post-test’ in the Variable2 box and then click on Ok.

Output of Paired‑Samples T Test
First, we will get the ‘Paired Samples Statistics’ table, which gives the mean, standard deviation and standard error mean for the two tested variables.

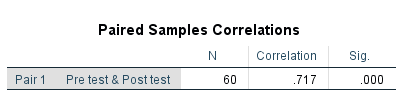
Then, we will get ‘Paired Samples Correlations’ table, which gives the correlation coefficient value. Pre-test and post-test marks were significantly and positively correlated (r=0.717).
Then, we will get ‘Paired Samples Test’ table

We will get mean, standard deviation and standard error mean values for the differences between the two variables. Here, p value (Sig (2‑tailed)) was equal to 0.000. Hence, a significant difference could be inferred between pre-test marks and post-test marks of students. Here, the t value of -5.694 was the test statistic for the paired T test.