
Mann - Whitney U Test in SPSS
Mann-Whitney U test is used to compare the means of two groups. Mann-Whitney U test is the nonparametric equivalent of the independent sample t-test. While the t-test makes an assumption about the distribution of a population, Mann‑Whitney U Test does not make such assumption.
u test in SPSS
Mann-Whitney U test have the following hypotheses:
Null hypothesis: The two populations are equal.
Alternative hypothesis: The two populations are not equal.
Assumption
1. Dependent variable should be continuous.
2. Independent variable should be of two categories.
3. Independence of observations is required.
4. Observations are not normally distributed. However, observations should follow the same shape (i.e., bell-shaped and skewed left)
Systolic Blood Pressure is considered as the dependent variable and Exercise is considered as the independent variable. We labelled 1 as No and 2 as Yes.
In SPSS, Mann-Whitney U test is found in Analyze > Nonparametric Tests > Legacy Dialogs > 2 Independent Samples

We will get ‘Two‑Independent‑Samples Tests’ dialog box.

We have to add dependent variable (Systolic Blood Pressure) in ‘Test Variable List’ box and independent variable (Exercise) in ‘Grouping Variable’ box. We have to click on ‘Mann‑Whitney U’ box under ‘Test Type’ group.

In the ‘Define Groups’ option, enter 1 in ‘Group 1’ box and enter 2 in ‘Group 2’ box. This is because Exercise group was categorised into ‘No’ and ‘Yes’. Click on ‘Continue’.

In the ‘Options’ box, we have to click on ‘Descriptive’ box under the ‘Statistics’ group and then click on Continue and Ok.

Output of Mann-Whitney U Test
First, we will get ‘Descriptive Statistics’ table, which gives mean, standard deviation, minimum and maximum value for the dependent and independent variables.

Then, we will get ‘Ranks’ table, which presents mean rank and sum of ranks for the two groups tested. Here, high rank value is for people who do not exercise. Thus, it can be concluded that Systolic Blood Pressure will be more for people who do not exercise.

Then, we will get ‘Test Statistics’ table. It can be observed that the p value (Asymp. Sig. (2‑tailed)) is 0.000, which is less than 0.05. Therefore, significant evidence is available to reject the null hypothesis.
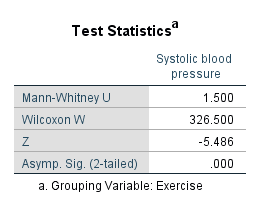
Finally, it can be concluded that Exercise category ‘Yes’ (N=25) has a larger mean rank (33.91) than Exercise category ‘No’ (N=17) with a mean rank (13.06). A statistically significant difference was found (Mann‑Whitney U=1.500 p<0.001).
Data: Mann-Whitney_U_Test_Data.sav
If you want to speak to us for any assistance, kindly Contact:
124, 4th cross, Maple Meadows Phase 2,
Nadagowda Gollahalli, Bangalore- 560 077
Phone number: 9731988227, 9741871657
Mail : in**@***************cs.com